30 Day Map Challenge Day 3 and 4
Note: for thoses interested in the code for each visualization you can see it by pressing the “Show All Code” button at the top right of the page or by pressing the “Code” button above and to the right of each visualization.
Day 3 - Polygons
The cells of mobile networks can be modeled using Voronoi diagrams. Typically this is done for mobility analysis with cell phone signaling data, as shown in this paper.
library(tidyverse)
library(sf)
library(httr)
library(ggvoronoi)
library(ggmap)

ign_geoserver_base_url <- "https://wms.ign.gob.ar/geoserver/ows"

ign_geoserver_query <- list(service="wfs",
                            version="1.1.0",
                            request="GetFeature",
                            typeNames="ign:departamento",
                            cql_filter="in1='02007'")

ign_geoserver_url <- modify_url(url = ign_geoserver_base_url,
                                query = ign_geoserver_query)

comuna1_sf <- read_sf(ign_geoserver_url)

comuna1_centroid <- st_centroid(comuna1_sf)
comuna1_bbox <- st_bbox(comuna1_sf)

idecom_geoserver_base_url <- "https://www.idecom.gob.ar/geoserver/ows"

idecom_geoserver_query <- list(service="wfs",
                               version="1.3.0",
                               request="GetFeature",
                               typeNames="publico:Antenas103-NO4G-5-3",
                               cql_filter=paste0("BBOX(the_geom,", paste(comuna1_bbox[c(2,1,4,3)], collapse = ","), ")", " AND Banda='7'"))

idecom_geoserver_url <- modify_url(url=idecom_geoserver_base_url,
                                   query = idecom_geoserver_query)

radiobases_4g_comuna1 <- read_sf(idecom_geoserver_url)

radiobases_4g_comuna1 <- radiobases_4g_comuna1 %>%
  as_Spatial() %>%
  sp::remove.duplicates() %>%
  st_as_sf() %>%
  na.omit()

register_google(Sys.getenv("GOOGLE_MAPS_API_KEY"))
comuna1_map <- get_googlemap(center = c(lon=-58.37869433449463,
                                        lat=-34.606838945727),
                             zoom = 15)

ggmap(comuna1_map,
      base_layer = ggplot(data = na.omit(st_drop_geometry(radiobases_4g_comuna1)),
                          aes(Longitud, Latitud))) +
  geom_path(stat = "voronoi", alpha = 0.6, size = 0.4) +
  geom_point(color = "blue", size = 0.7) +
  theme_minimal() +
  theme(axis.text = element_blank(),
        axis.title = element_blank())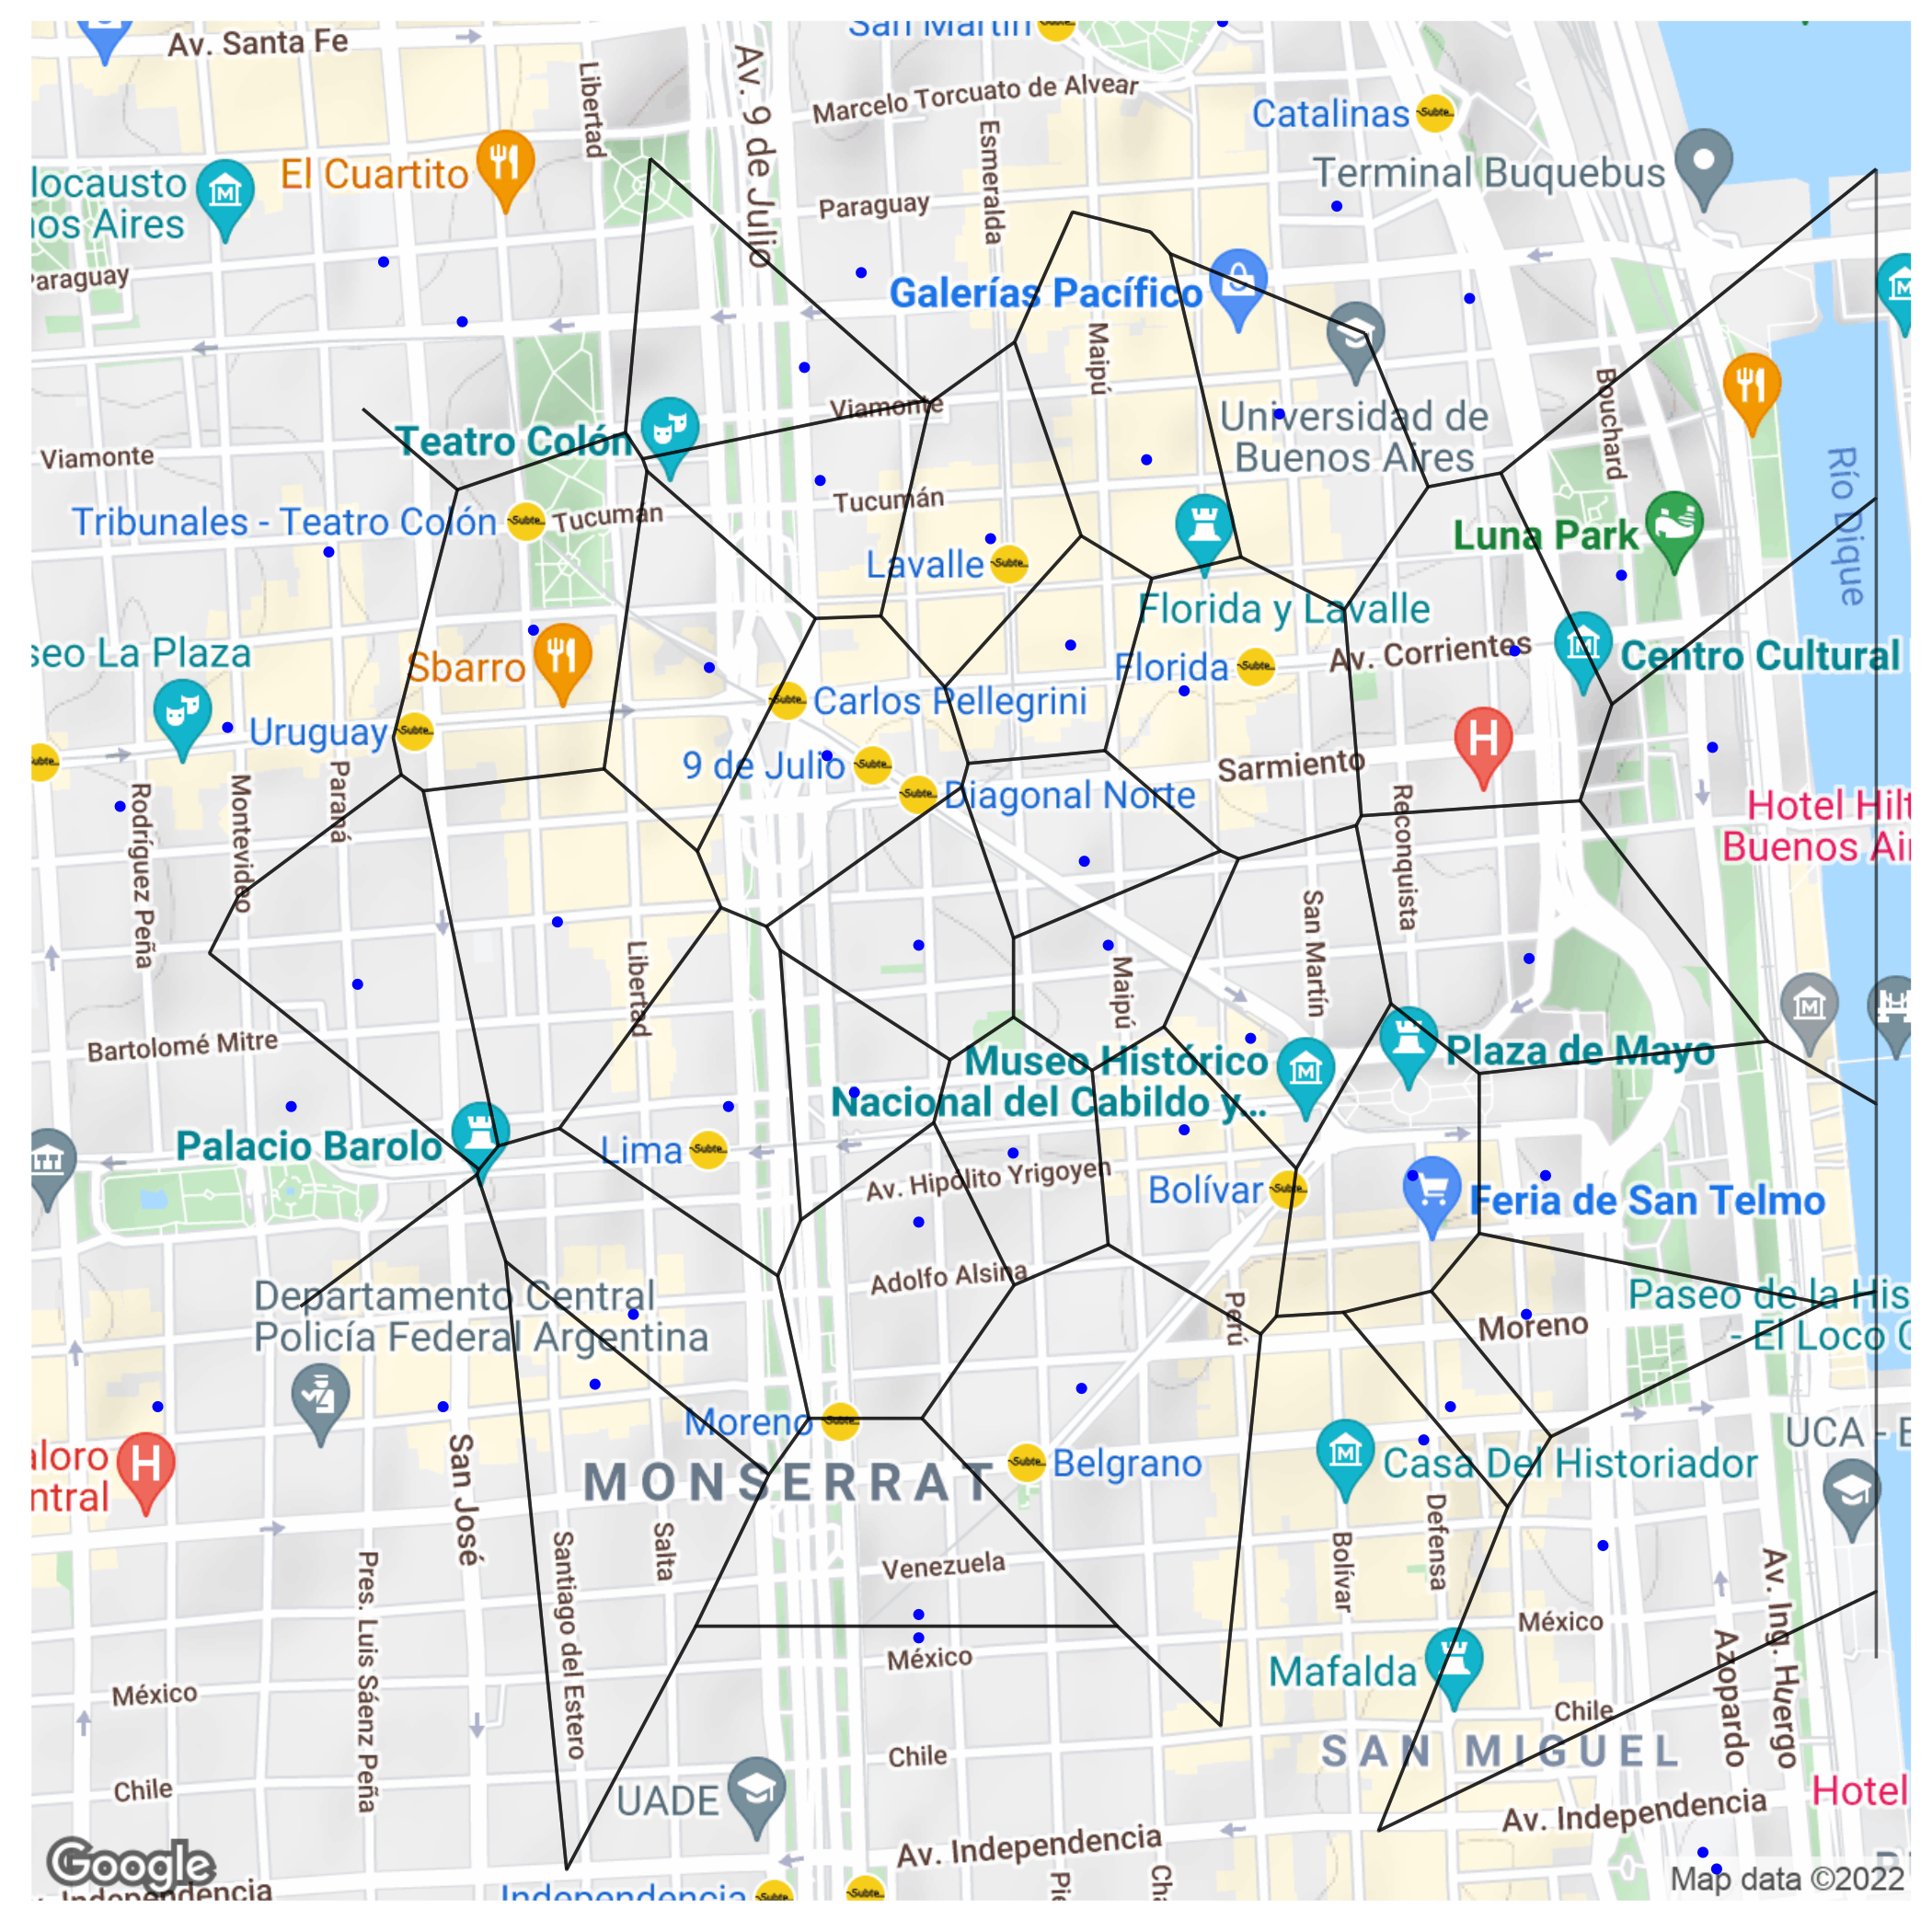
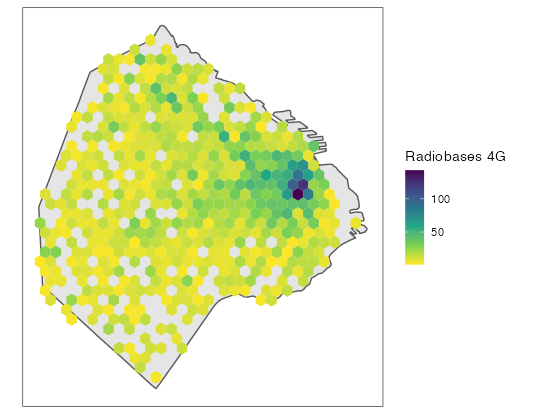
Day 4 - Hexagons
Hexagons can also be used to visualize 4G base stations, using the color intensity to show density.
library(hexbin)

ign_geoserver_base_url <- "https://wms.ign.gob.ar/geoserver/ows"

ign_geoserver_query <- list(service="wfs",
                            version="1.1.0",
                            request="GetFeature",
                            typeNames="ign:provincia",
                            CQL_FILTER="in1='02'")

ign_geoserver_url <- modify_url(url = ign_geoserver_base_url,
                                query = ign_geoserver_query)
caba <- read_sf(ign_geoserver_url)

caba_bb <- st_bbox(caba)

idecom_geoserver_base_url <- "https://www.idecom.gob.ar/geoserver/ows"

idecom_geoserver_query <- list(service="wfs",
                               version="1.3.0",
                               request="GetFeature",
                               typeNames="publico:Antenas103-NO4G-5-3",
                               cql_filter=paste0("BBOX(the_geom,", paste(caba_bb[c(2,1,4,3)], collapse = ","), ")"))

idecom_geoserver_url <- modify_url(url=idecom_geoserver_base_url,
                                   query = idecom_geoserver_query)

radiobases_4g_caba <- read_sf(idecom_geoserver_url)

if(st_crs(caba)!=st_crs(radiobases_4g_caba)) {
  radiobases_4g_caba <- st_transform(radiobases_4g_caba, crs = st_crs(caba))
}
radiobases_4g_caba <- st_join(radiobases_4g_caba, caba, left=FALSE)

caba %>%
  ggplot() +
  geom_sf() +
  geom_hex(data = radiobases_4g_caba, aes(Longitud, Latitud)) +
  theme_bw() +
  coord_sf(datum = NA) +
  scale_fill_viridis_c(direction = -1, name = "Radiobases 4G") +
  theme(axis.title.x = element_blank(),
        axis.title.y = element_blank())