In Argentina, as in many other countries, there is a fund made up of contributions from companies in the ICT sector with the goal of bringing services to populations that have no access to them for various reasons. In this post, I participated in a panel where I talked about the history of this fund in Argentina, called the Universal Service Trust Fund (FFSU), its regulatory framework and the different programs it has today.
In this post, I will develop a small exploratory analysis of some of the data regarding the two most important programs of the FFSU: the Connectivity Program and the Vulnerable Neighborhoods Program. The analysis covers the years between 2020 and 2023, for which data is available. The data was extracted from the minutes of the meetings of the Board of Directors of the National Communications Entity (ENACOM), which are published in PDF on the agency’s website.
Connectivity Program
Code
# Me conecto a la base de datos y leo la tabla del Programa Conectividad# Connect to the database and read the Conectividad Program tablefrom dotenv import load_dotenvfrom sqlalchemy import create_engineimport osimport pandas as pdload_dotenv()host = os.getenv("HOST")port = os.getenv("PORT")database = os.getenv("DBNAME")user = os.getenv("USER")password = os.getenv("PASSWD")engine = create_engine(f"postgresql://{user}:{password}@{host}:{port}/{database}")anr_prog_con = pd.read_sql_table(table_name="conectividad_aprob_georef", con=engine)
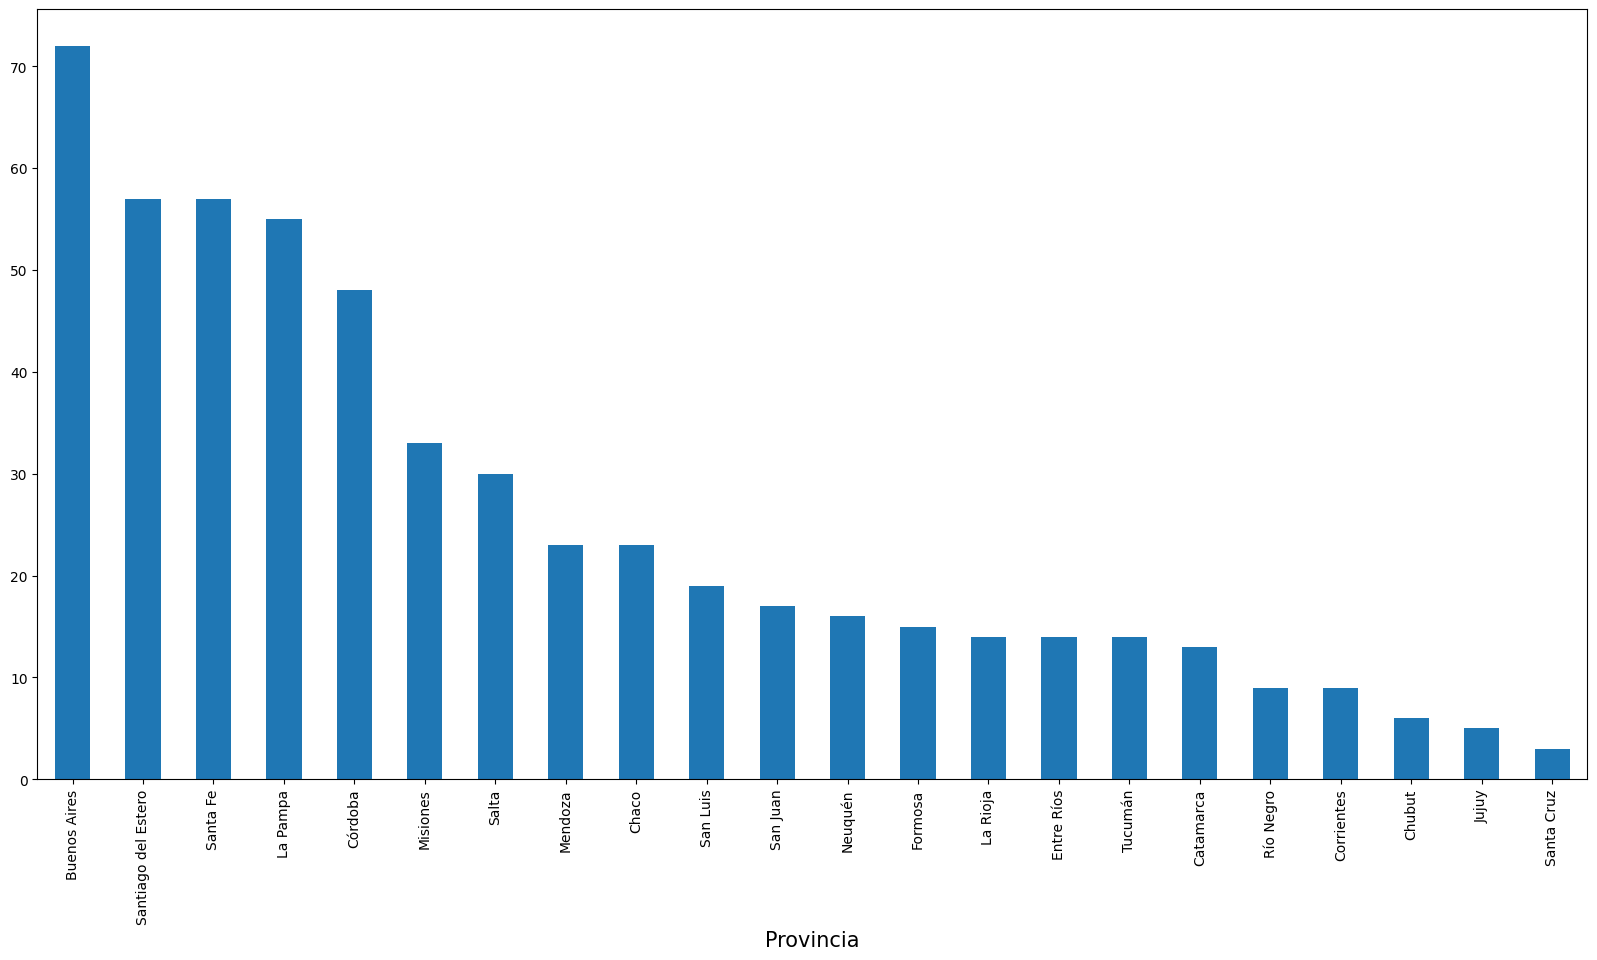
The Figure 1 shows the number of localities that were beneficiaries from ANRs from the Connectivity Program approved by province, between 2020 and 2023.
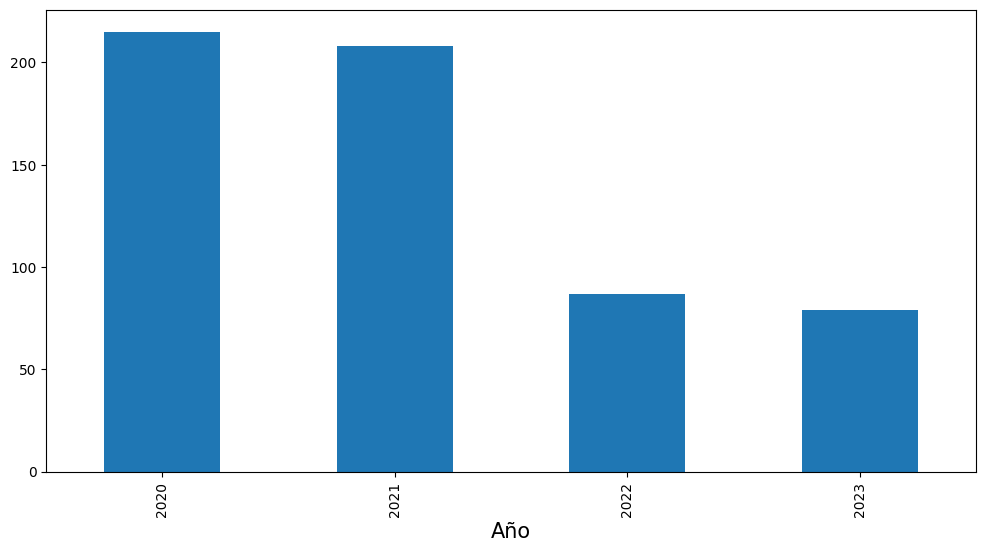
Figure 2: Localidades beneficiarias de ANRs del Prog. Conectividad por año
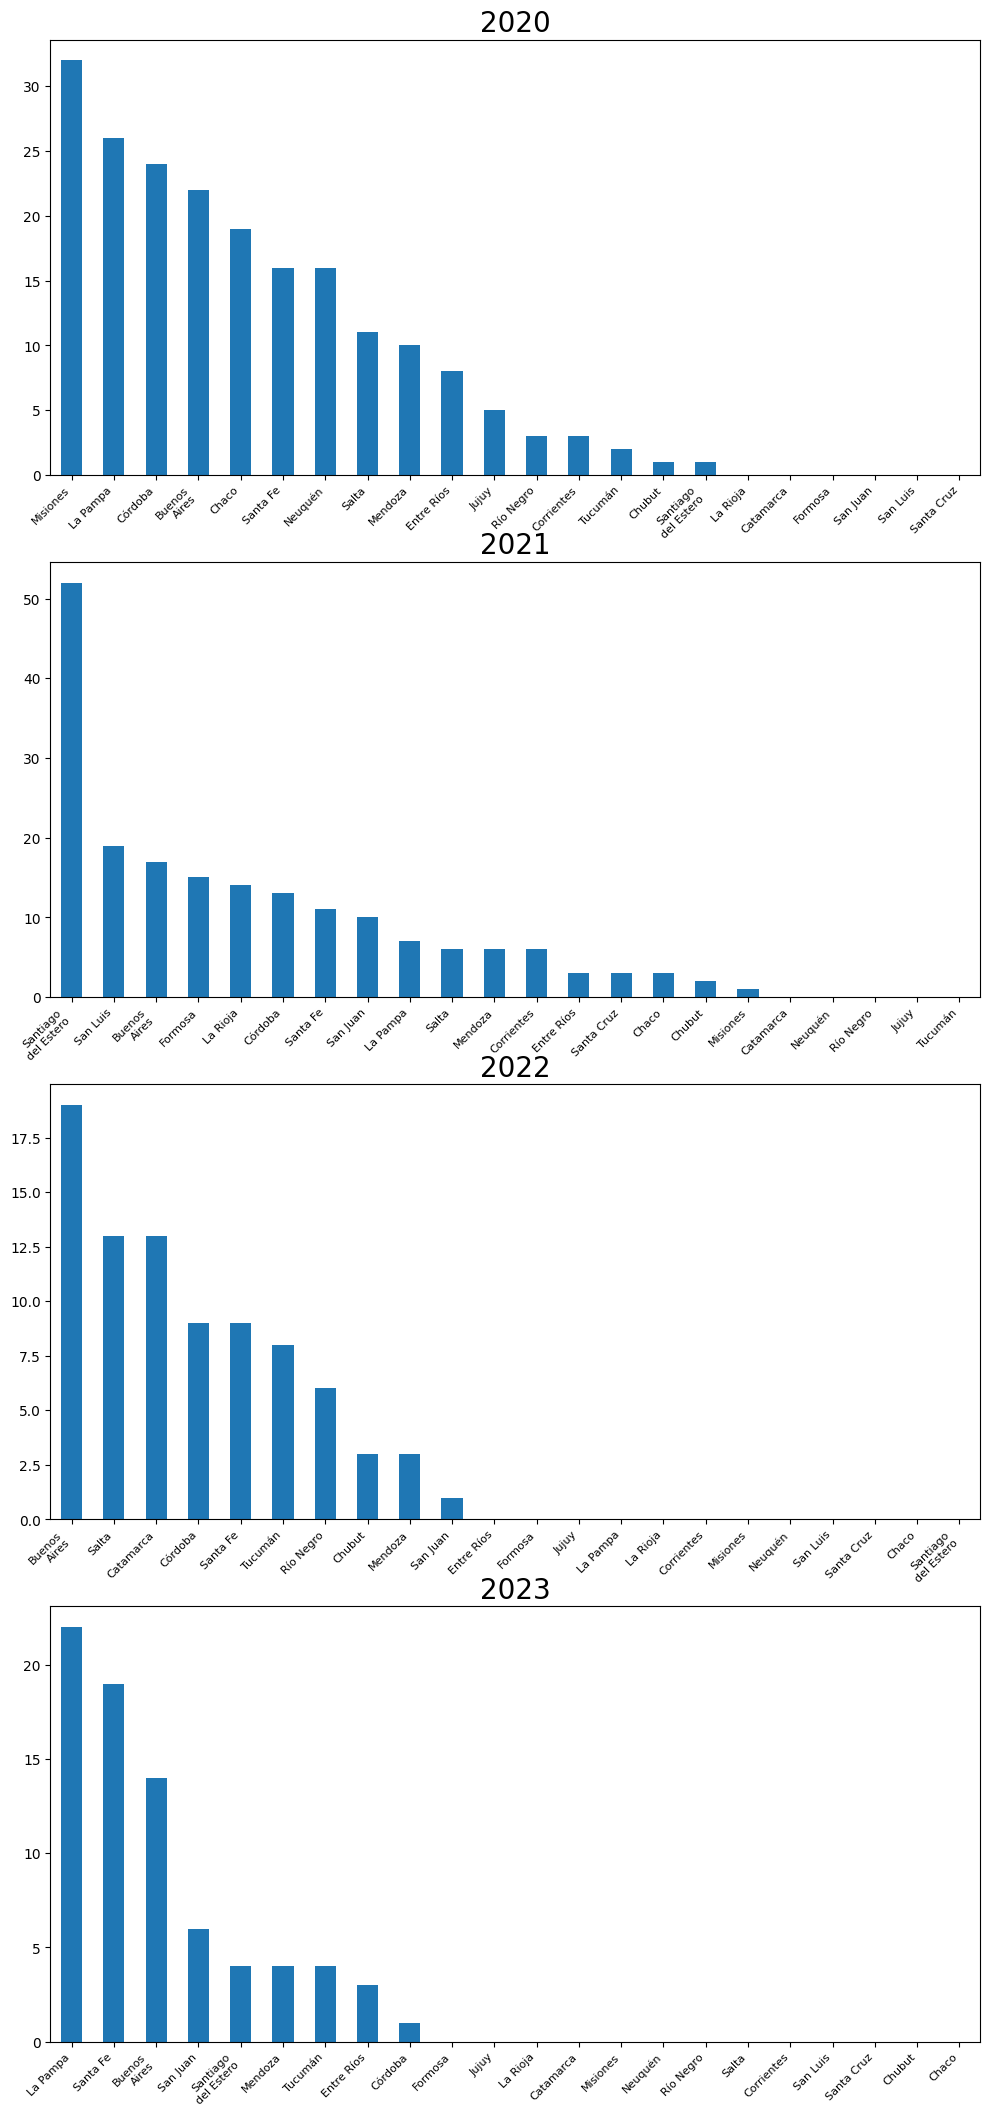
The Figure 3 shows the number of localities that were beneficiairies from ANRs from the Connectivity Program by year and province.
Code
import textwrapanr_prog_con_prov_anio = anr_prog_con.groupby(['anio', 'provincia_indec']).size().unstack().fillna(0)fig, ax = plt.subplots(4,1)for i, anio inenumerate(anr_prog_con_prov_anio.index): anr_prog_con_prov_anio.loc[anio].sort_values(ascending=False).plot(ax=ax[i], kind='bar', figsize=(12,26), legend=False) ax[i].set_title(f"{anio}", fontsize=20) ax[i].set_xlabel("") ax[i].set_xticklabels([textwrap.fill(label.get_text(), 10) for label in ax[i].get_xticklabels()], rotation=45, fontsize=8, ha='right') # Wrap labels
Figure 3: Localidades beneficiarias de ANRs del Prog. Conectividad por año y provincia
Vulnerable Neighborhoods Program
Code
# Me conecto a la base de datos y leo la tabla del Programa Barrios Populares# Connect to the database and read the Barrios Populares Program tableimport geopandas as gpdanr_prog_renabap = gpd.read_postgis("SELECT * FROM renabap_aprob", con=engine, geom_col="geometry")
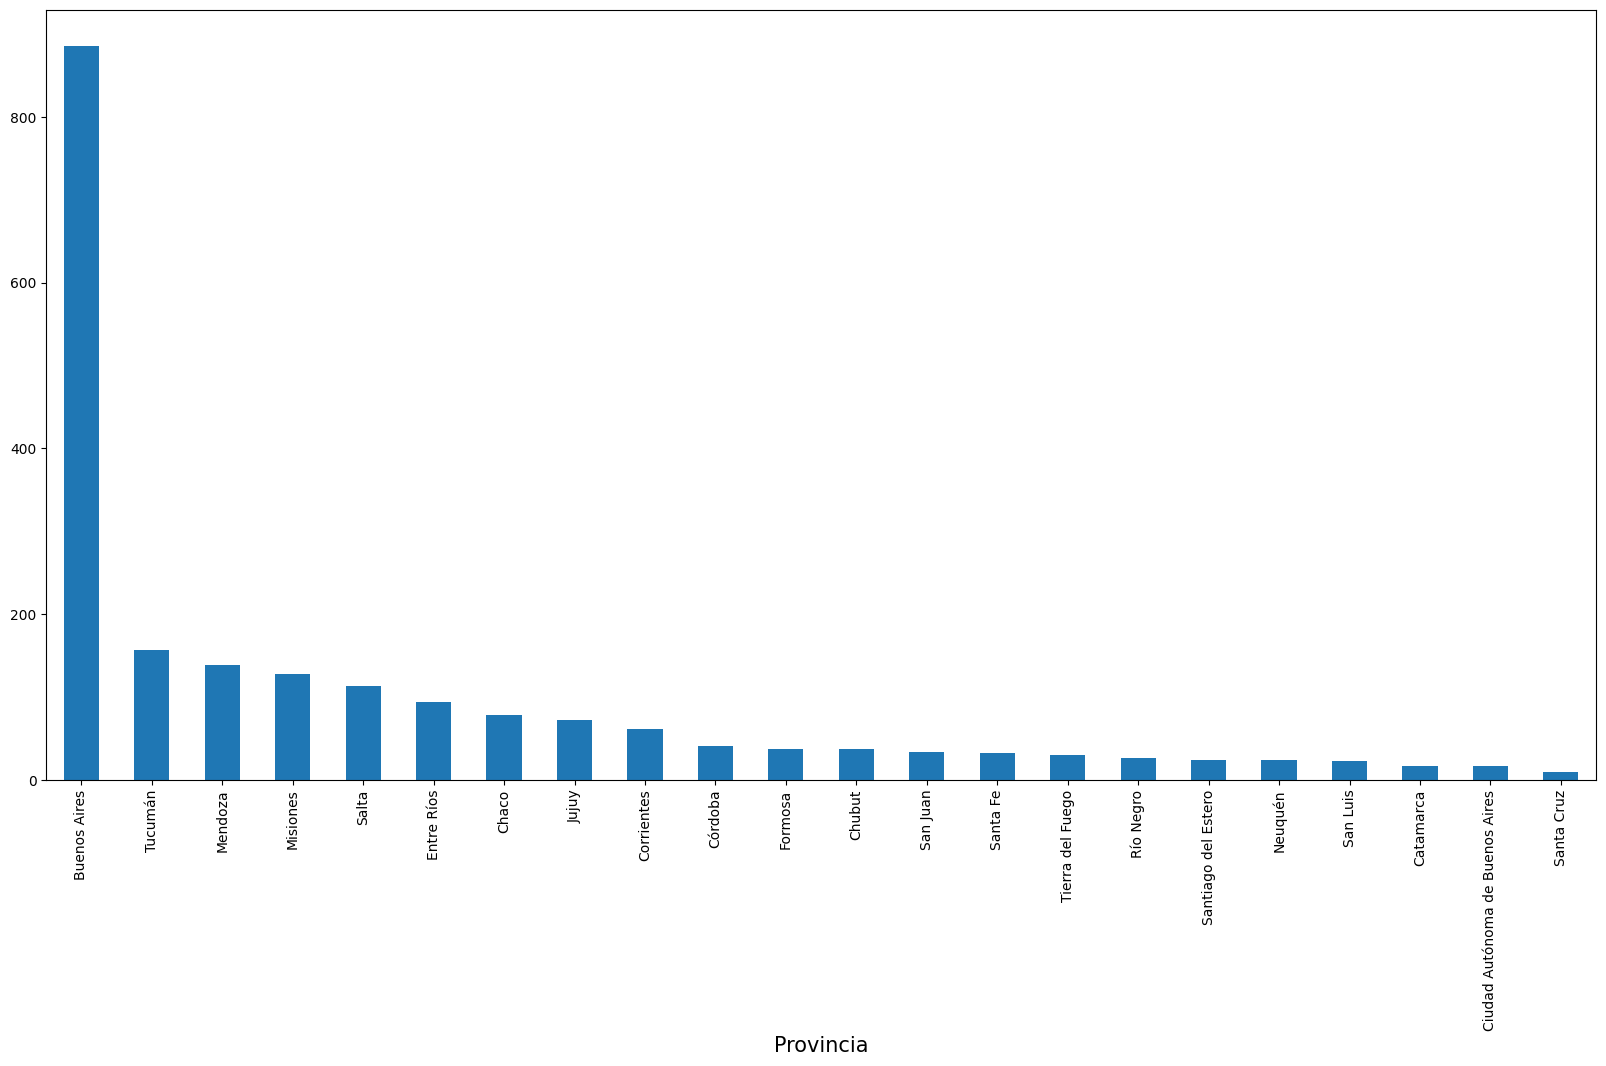
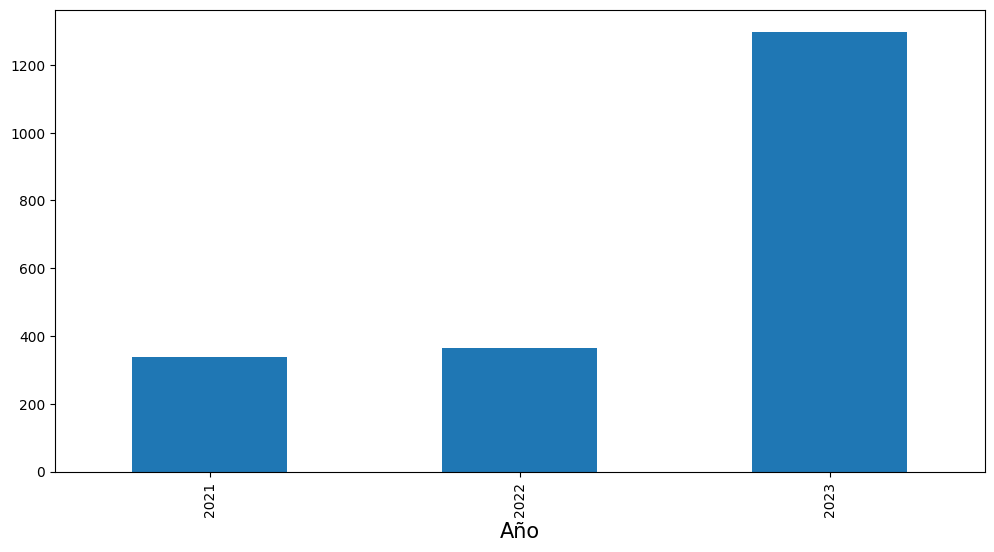
The Figure 4 shows the number of neighborhoods that were beneficiaries of ANRs from the Vulnerable Neighborhoods Program by province, between 2021, the year in which the program began, and 2023.
Figure 5: Barrios beneficiados con ANRs del Prog. Barrios Populares aprobados por año
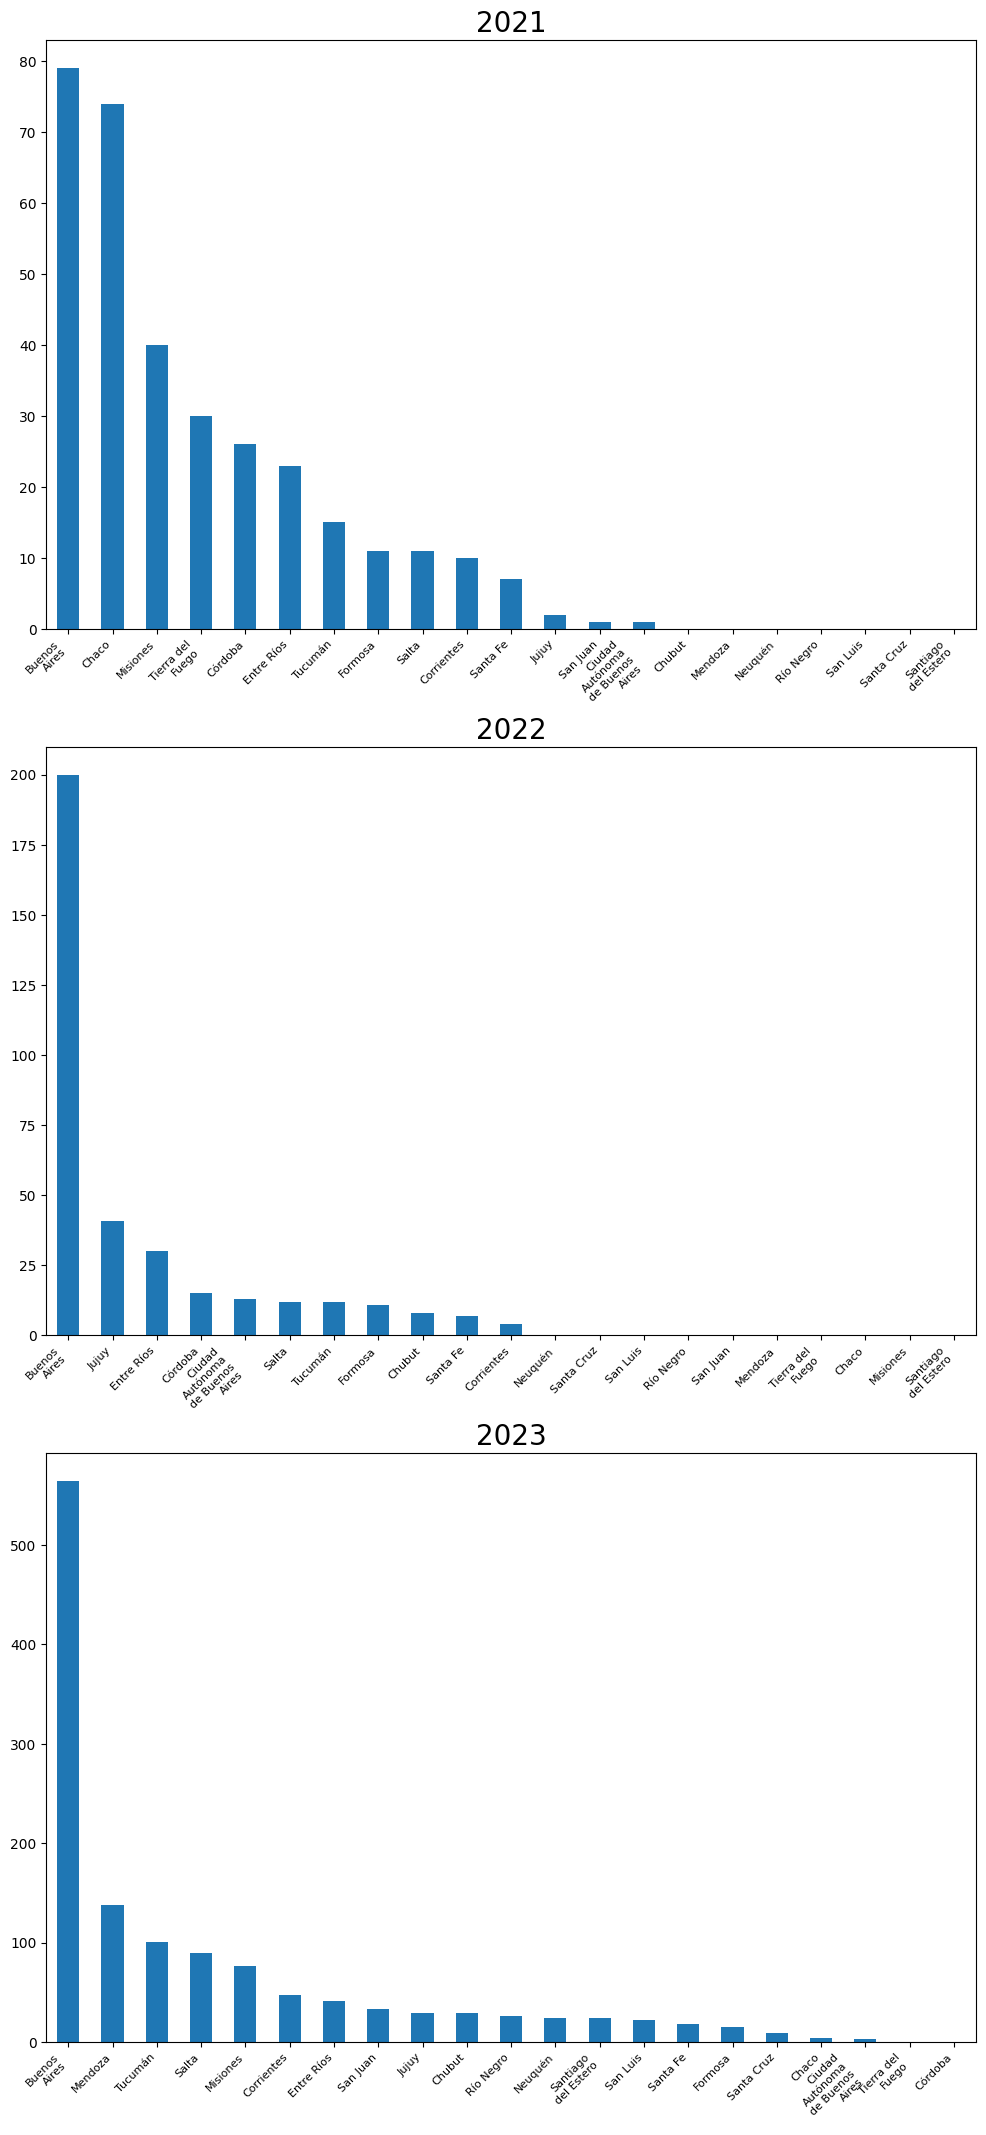
The Figure 6 shows the number of neighborhoods that were beneficiaries of ANRs from the Vulnerable Neighborhoods Program by year and province.
Code
import textwrapanr_prog_renabap_prov_anio = anr_prog_renabap.groupby(['anio', 'provincia']).size().unstack().fillna(0)fig, ax = plt.subplots(3,1)for i, anio inenumerate(anr_prog_renabap_prov_anio.index): anr_prog_renabap_prov_anio.loc[anio].sort_values(ascending=False).plot(ax=ax[i], kind='bar', figsize=(12,26), legend=False) ax[i].set_title(f"{anio}", fontsize=20) ax[i].set_xlabel("") ax[i].set_xticklabels([textwrap.fill(label.get_text(), 10) for label in ax[i].get_xticklabels()], rotation=45, fontsize=8, ha='right') # Wrap labels
Figure 6: Barrios beneficiados por ANRs del Prog. Barrios Populares aprobados por año y provincia
Beyond these graphs about the number of localities and vulnerable neighborhoods that were beneficiaries, it would be interesting to analyze the impact of these programs on the connectivity of the beneficiary populations. We will try to approach this issue in a future post.