30 Days Map Challenge Day 1 and 2

30 Days Map Challenge Día 1 y 2

Author

Martin Olmos

Published

November 6, 2021

Note: for those interested in the code used to generate each visualization, you can see it by pressing the “Show/Hide All Code” button at the top right of the page or the “Code” button at the top right of each visualization.

The #30daymapchallenge is a mapping/cartography/data visualization challenge powered by the data science community. The idea is to publish maps based on a daily challenge for 30 days using the hashtag #30daymapchallenge.

Here are the daily themes for this year’s challenges:

In particular, I am going to focus (whenever I can) on data related to ICTs.

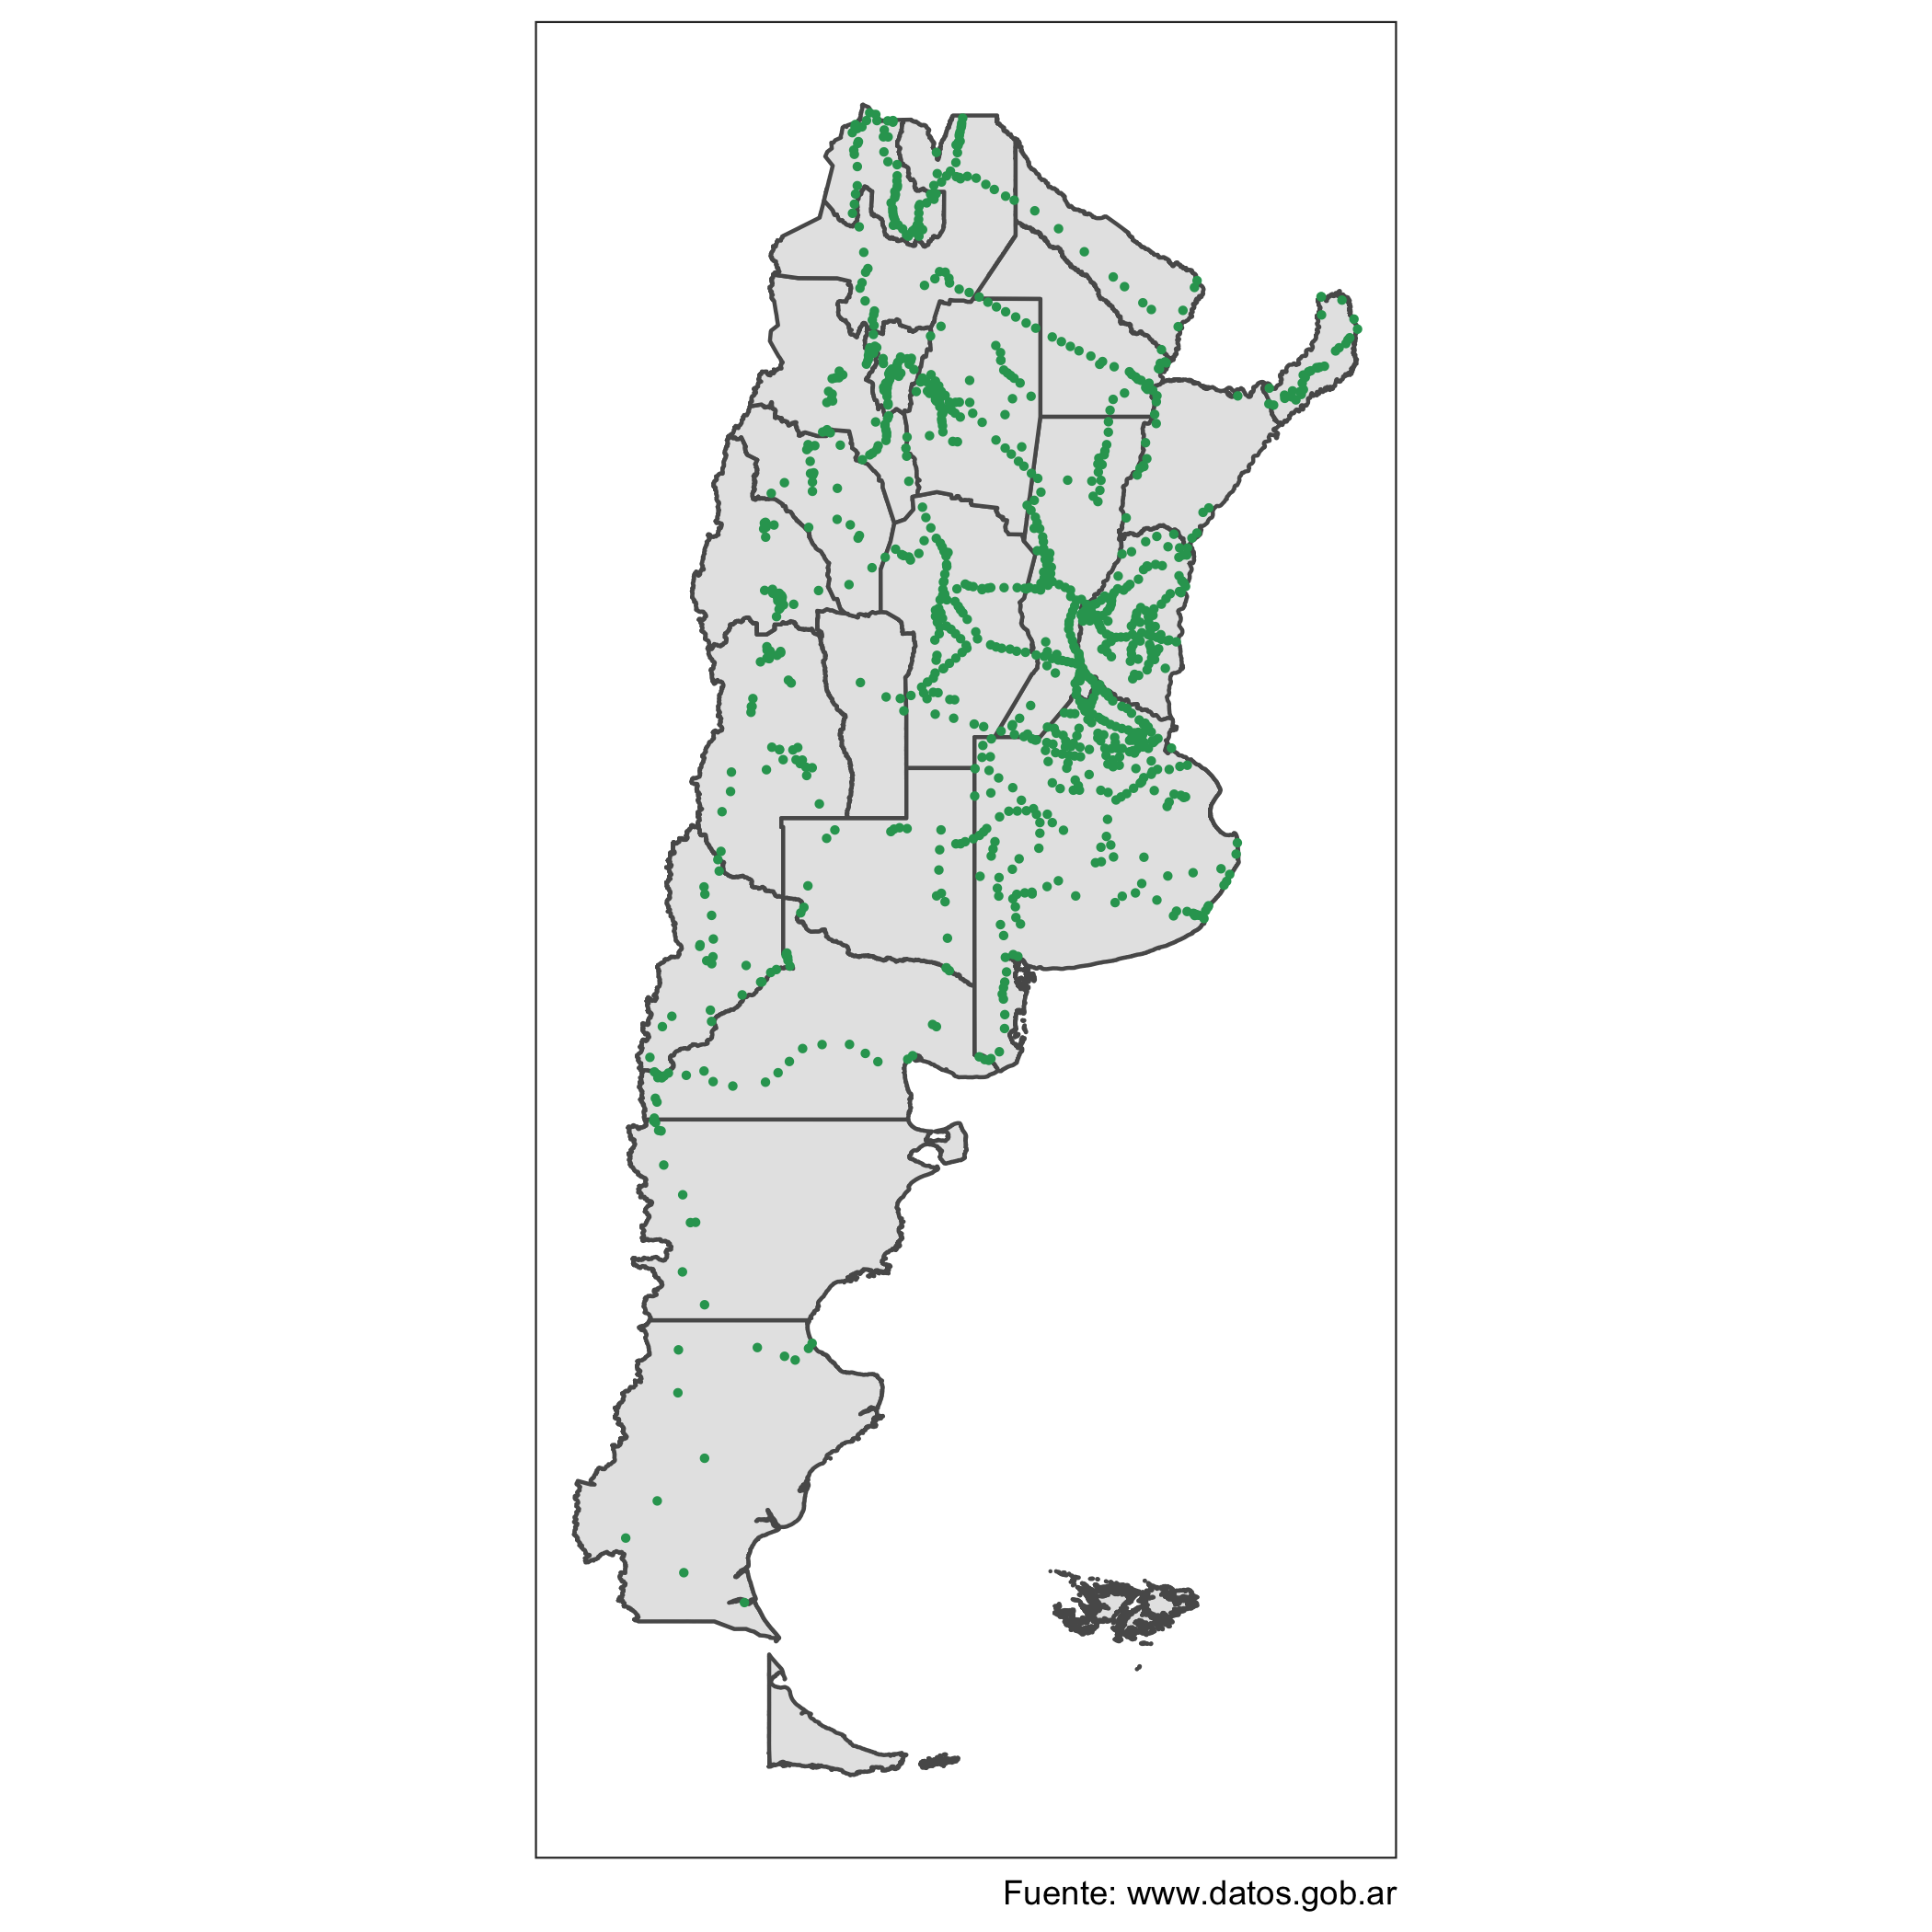
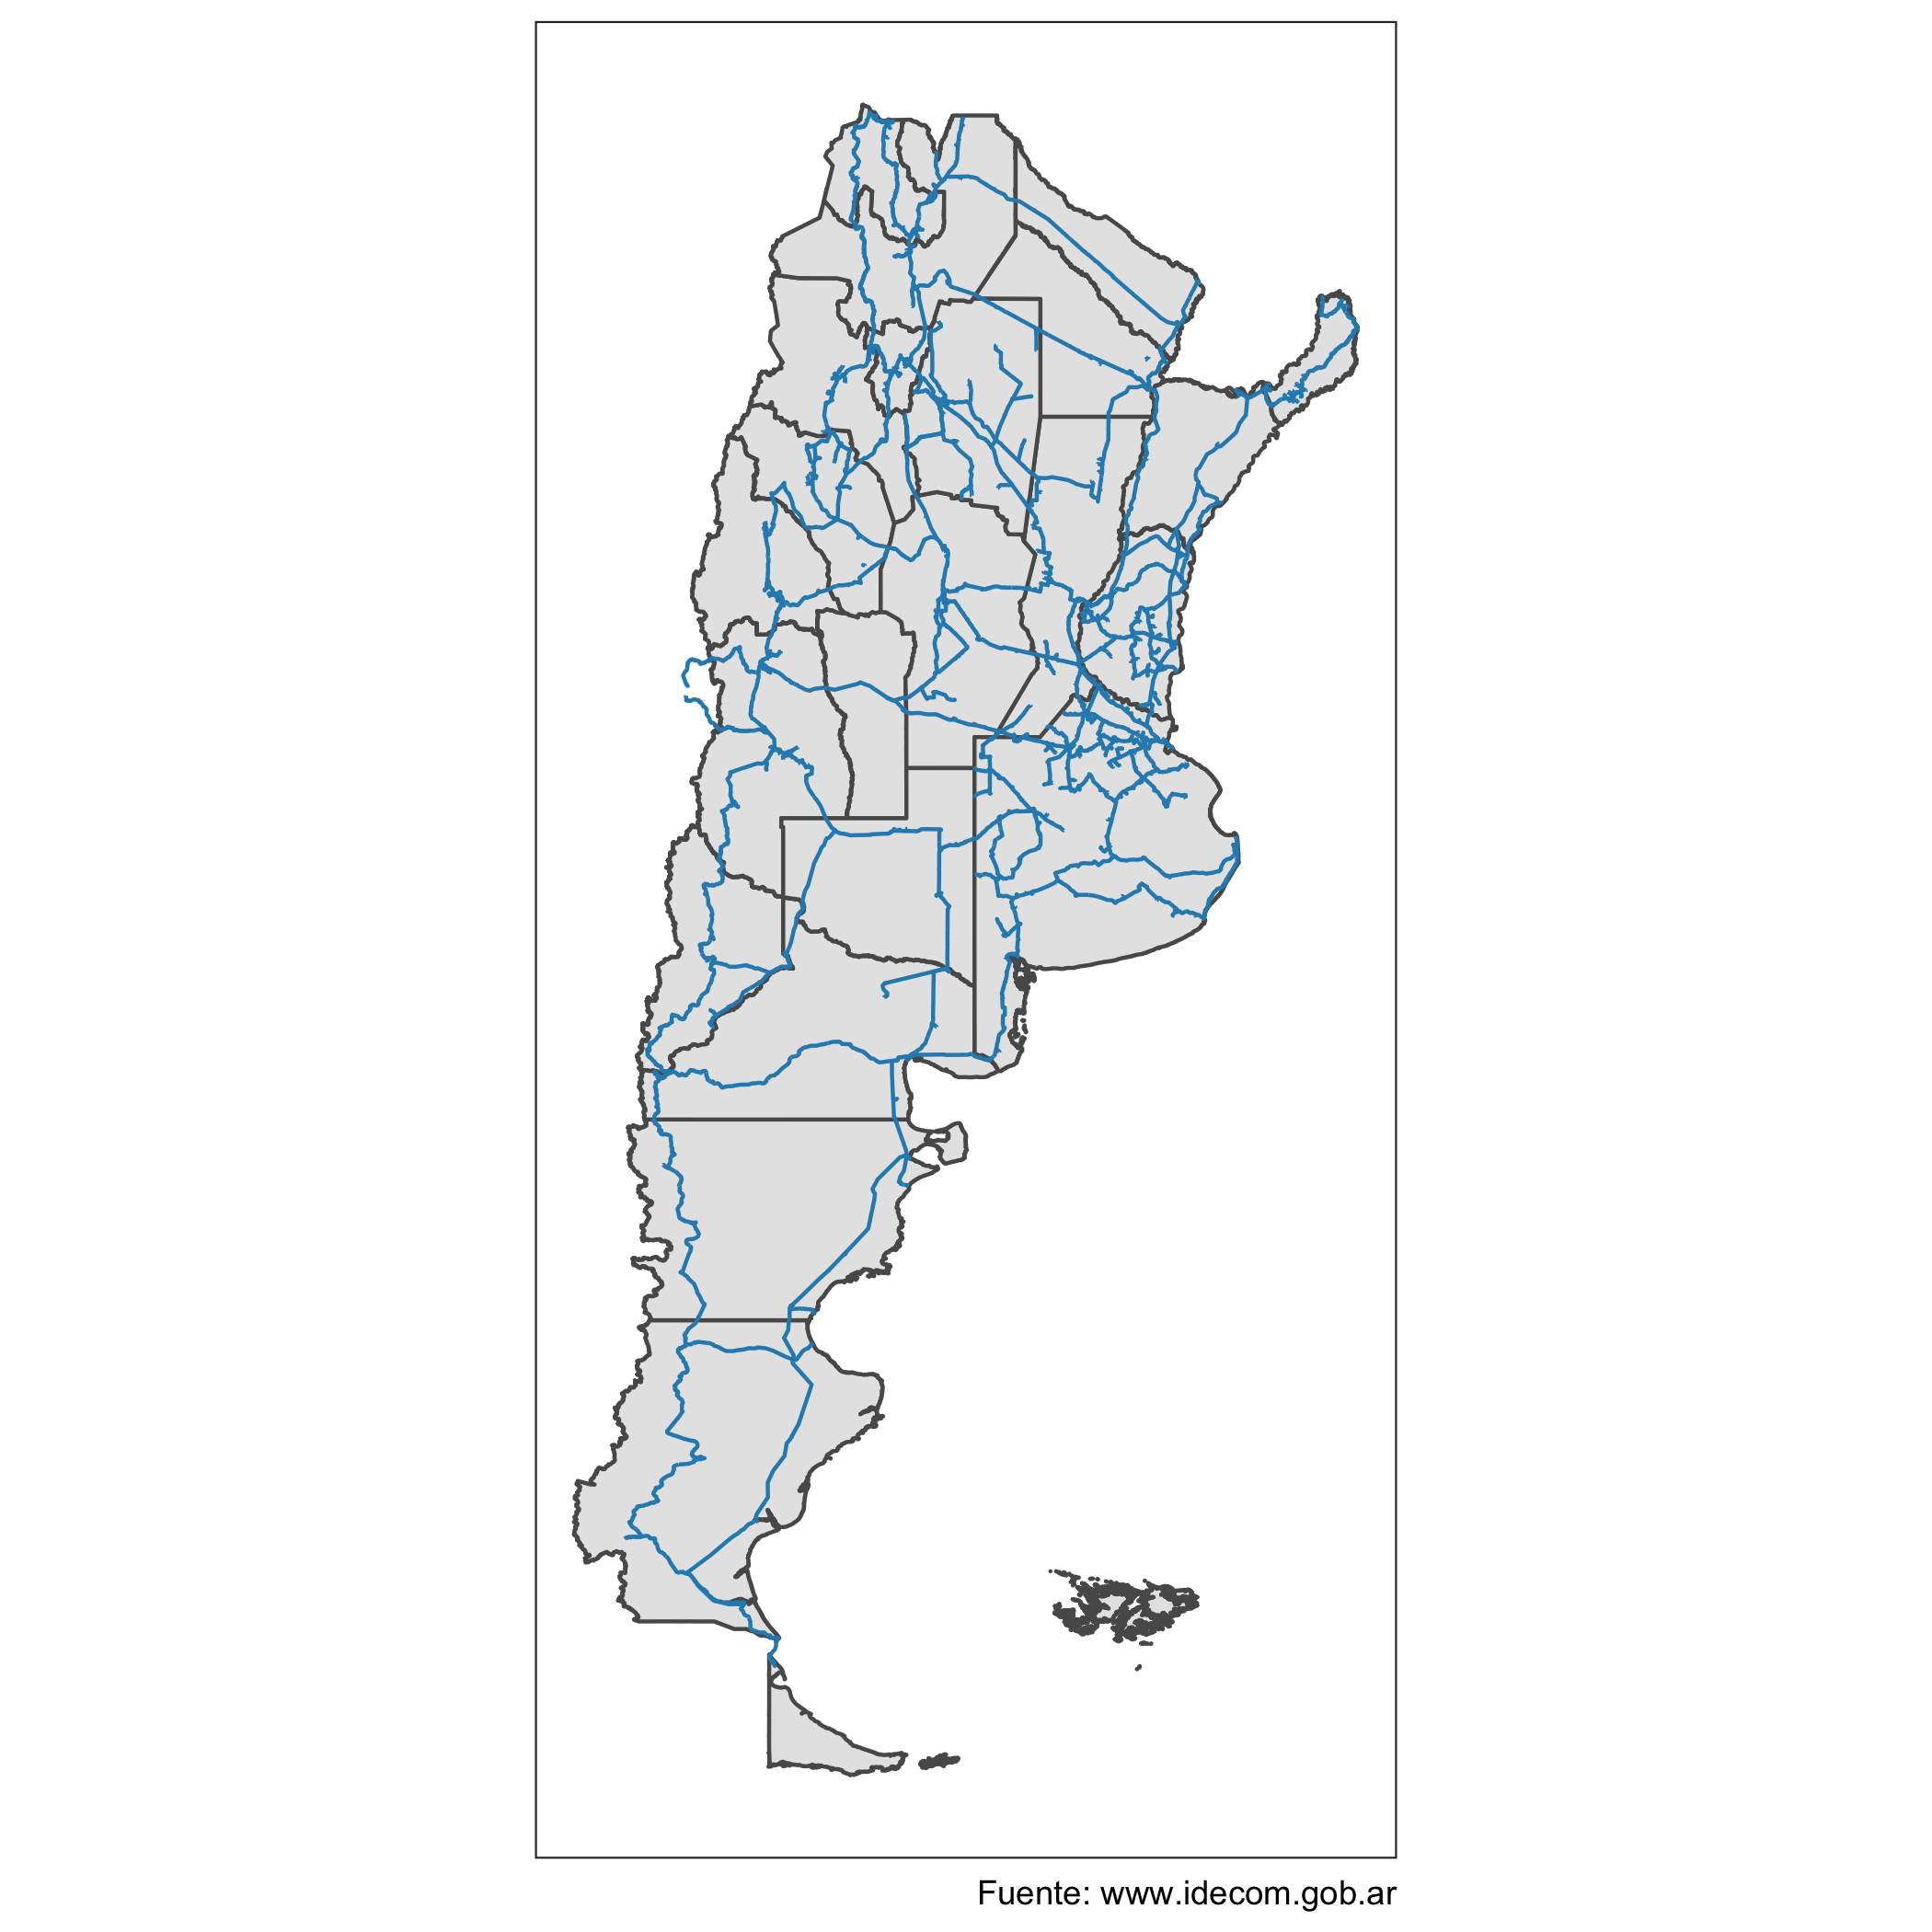
Let’s start with the challenges of days 1 (points) and 2 (lines).

Day 1 - Points

Connection nodes to the Federal Fiber Optic Network (REFEFO) of ARSAT.

The REFEFO is a fiber optic trunk network. Internet providers or ISPs connect to the connection points or nodes to bring internet services to final users.

Code
library(tidyverse)
library(sf)
sf_use_s2(FALSE)
library(httr)

provincias_ign <- read_sf("https://wms.ign.gob.ar/geoserver/ows?service=wfs&version=1.1.0&request=GetFeature&typeNames=ign:provincia&outputFormat=application/json")

if(sum(!st_is_valid(provincias_ign)) > 0) {
  provincias_ign <- st_make_valid(provincias_ign)
}

provincias_ign <- st_crop(x = provincias_ign,
                          y = st_bbox(obj = c(xmin=-76.36532,
                                              ymin=-56.75009,
                                              xmax=-51.20850,
                                              ymax=-20.91625)))

nodos_refefo <- read.csv2("https://datos.arsat.com.ar/dataset/8f0b4da0-a40d-4b2b-8fe0-dac06d64152a/resource/15713af0-f384-44c5-8397-c8050162312d/download/puntos-conexion-red-federal-de-fibra-optica-2021-12-01_v1.csv", fileEncoding = "LATIN1")

nodos_refefo <- nodos_refefo %>%
  na.omit() %>%
  st_as_sf(crs = 4326, coords=c("Longitud", "Latitud"), remove=FALSE)

nodos_refefo <- st_crop(x = nodos_refefo,
                        y = st_bbox(obj = c(xmin=-76.36532,
                                            ymin=-56.75009,
                                            xmax=-51.20850,
                                            ymax=-20.91625)))

provincias_ign %>% 
  ggplot() + 
  geom_sf() +
  geom_sf(data = nodos_refefo, color = "#2ca25f", size = 0.5) +
  coord_sf(datum = NA) +
  theme_bw() +
  labs(caption = "Fuente: www.datos.gob.ar / Source: www.datos.gob.ar")

Day 2 - Lines

Lay out of the REFEFO. The optical fiber of the REFEFO is generally buried next to national and provincial routes, connecting different small and medium-sized towns, where there are no other providers or there is only one and therefore there is no competition.

Code
idecom_base_url <- "https://www.idecom.gob.ar/geoserver/ows"
refefo_query <- list(service="wfs",
                     version="1.3.0",
                     request="GetFeature",
                     typeNames="publico:FO118-TZFO-REDFIBRAOPTICA-5-2",
                     CQL_FILTER="OBSERV='ARSAT - ReFeFO'",
                     outputFormat="application/json")

idecom_url <- modify_url(url = idecom_base_url, 
                         query = refefo_query)

traza_refefo_idecom <- read_sf(idecom_url)

provincias_ign %>% 
  ggplot() +
  geom_sf() +
  geom_sf(data = traza_refefo_idecom, colour="#2b8cbe") +
  coord_sf(datum = NA) +
  theme_bw() +
  labs(caption = "Fuente: www.idecom.gob.ar / Source: www.idecom.gob.ar")